组内消息
2019-12-10
Influences of the NAO on the North Atlantic CO2 Fluxes in Winter and Summer on the Interannual Scale

Highlights
• There is a large difference in the fCO2-NAO relationship between winter and summer in the subtropical region.
• On the interannual scale, the fCO2 variation is dominated by NAO-driven wind speed anomalies in winter, but by surface-ocean pCO2sea in summer.
• The pCO2sea variation is dominated by NAO-driven SSTs in the subtropical region and by other factors in the subpolar region.
Jing Yujie, Li Yangchun, Xu Yongfu, Fan Guangzhou. Influences of the NAO on the North Atlantic CO2 Fluxes in Winter and Summer on the Interannual Scale. Adv. Atmos. Sci. 36, 1288–1298 (2019). https://doi.org/10.1007/s00376-019-8247-2
Full text:https://link.springer.com/article/10.1007/s00376-019-8247-2
组内消息
2017-01-17

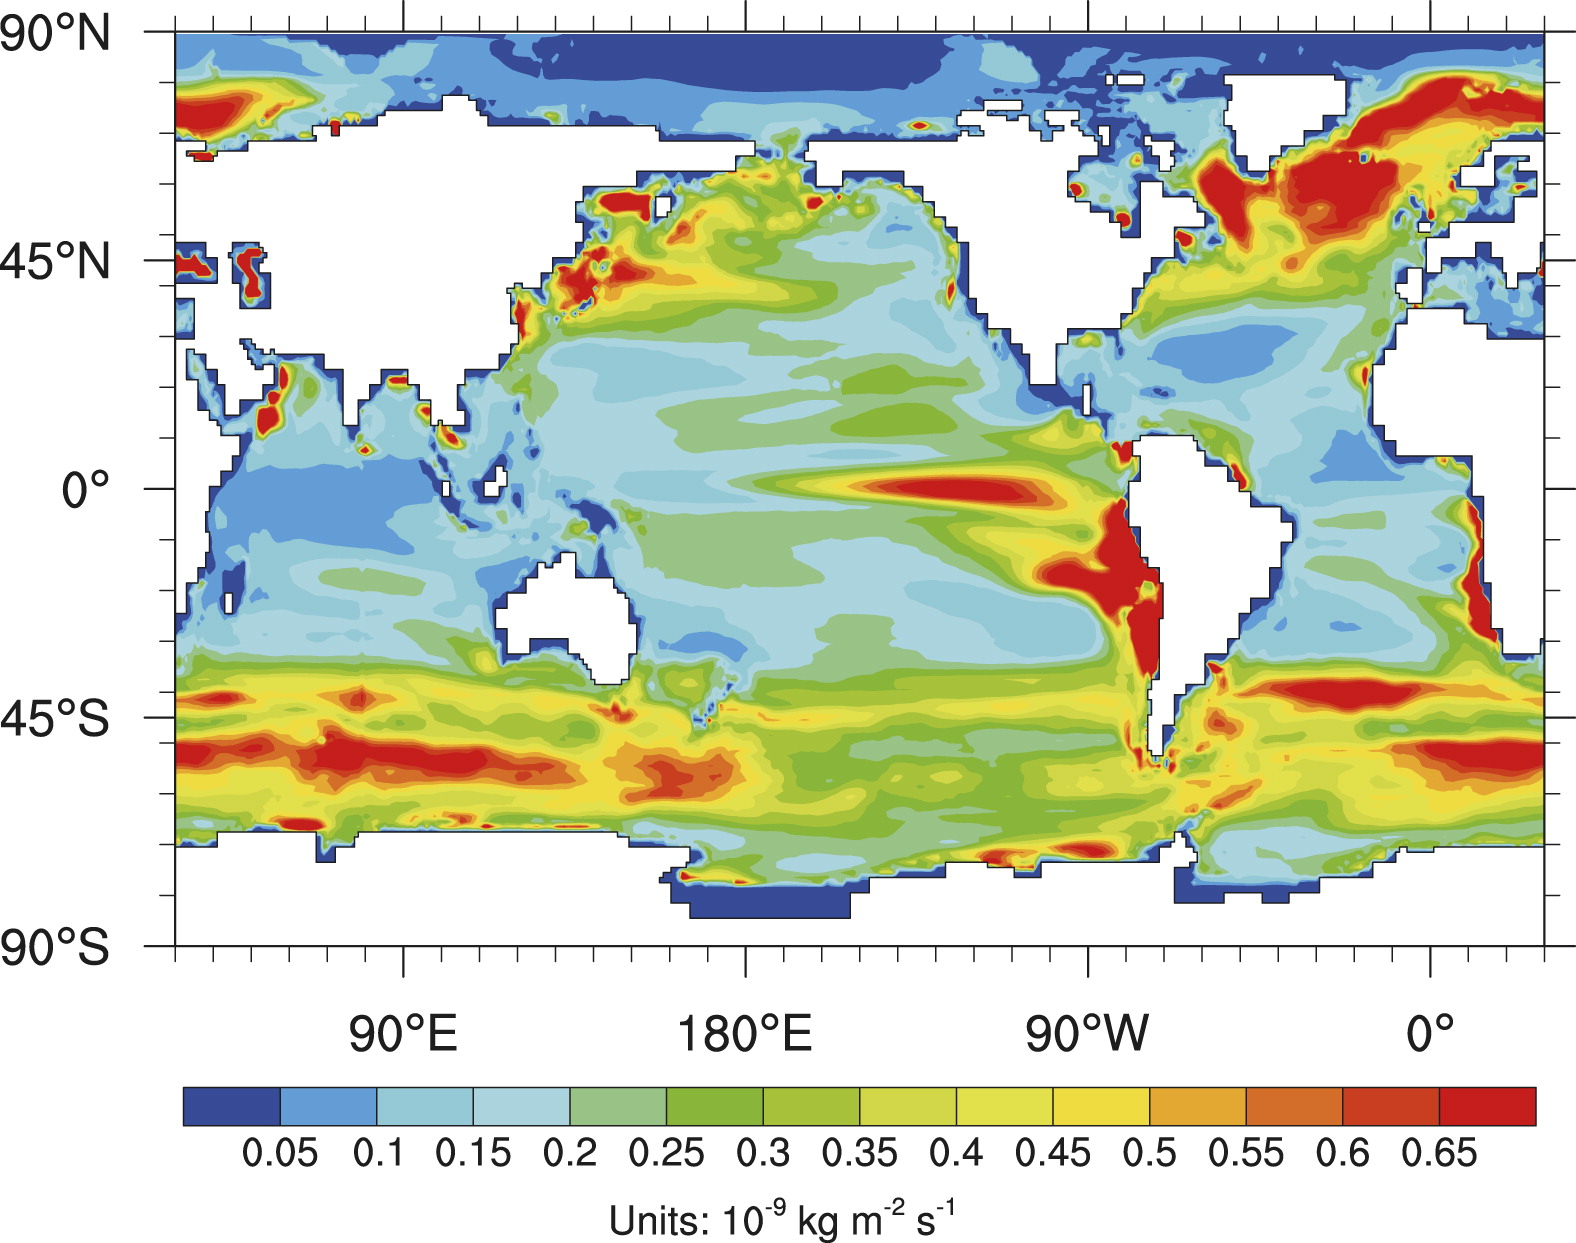
One standard deviation of the air–sea CO2 flux (10−9 kg m−2 s−1) among 18 models (the four models CMCC-CESM, INM-CM4.0, and GISS-E2-H/R-CC are excluded), based on the annual mean air–sea CO2 flux of the 18 models during 1996–2004. It indicates where models differ most in terms of air–sea CO2 flux.
To assess the capability of the latest Earth system models (ESMs) in representing historical global air–sea CO2 flux, 22 models from phase 5 of the Coupled Model Intercomparision Project (CMIP5) are analyzed, with a focus on the spatial distribution of multiyear mean and interannual variability. Results show that the global distribution of air–sea CO2 flux is reasonable in most of the models and that the main differences between models and observationally based results exist in regions with strong vertical movement. The annual mean flux in the 18-member multimodel ensemble (MME; four models were excluded because of their poor performances) mean during 1996–2004 is 1.95 PgC/yr (1 Pg = 1015 g; positive values mean into the ocean), and all but one model describe the rapid increasing trend of air–sea CO2 flux observed during 1960–2000. The first mode of the global air–sea CO2 flux variability during 1870–2000 in six of the models represents the El Niño–Southern Oscillation (ENSO) mode. The remaining 12 models fail to represent this important character for the following reasons: in five models, the tropical Pacific does not play a dominant role in the interannual variability of global air–sea CO2 flux because of stronger interannual variability in the Southern Ocean; two models poorly represent the interannual fluctuation of dissolved inorganic carbon (DIC) in the surface ocean of the tropical Pacific; and four models have shorter periods of the air–sea CO2 flux, which are out of the period range of ENSO events.
Dong F, Li Y, Wang B, et al. Global Air–Sea CO2Flux in 22 CMIP5 Models: Multiyear Mean and Interannual Variability[J]. Journal of Climate, 2016, 29(7): 2407-2431*
Full text


